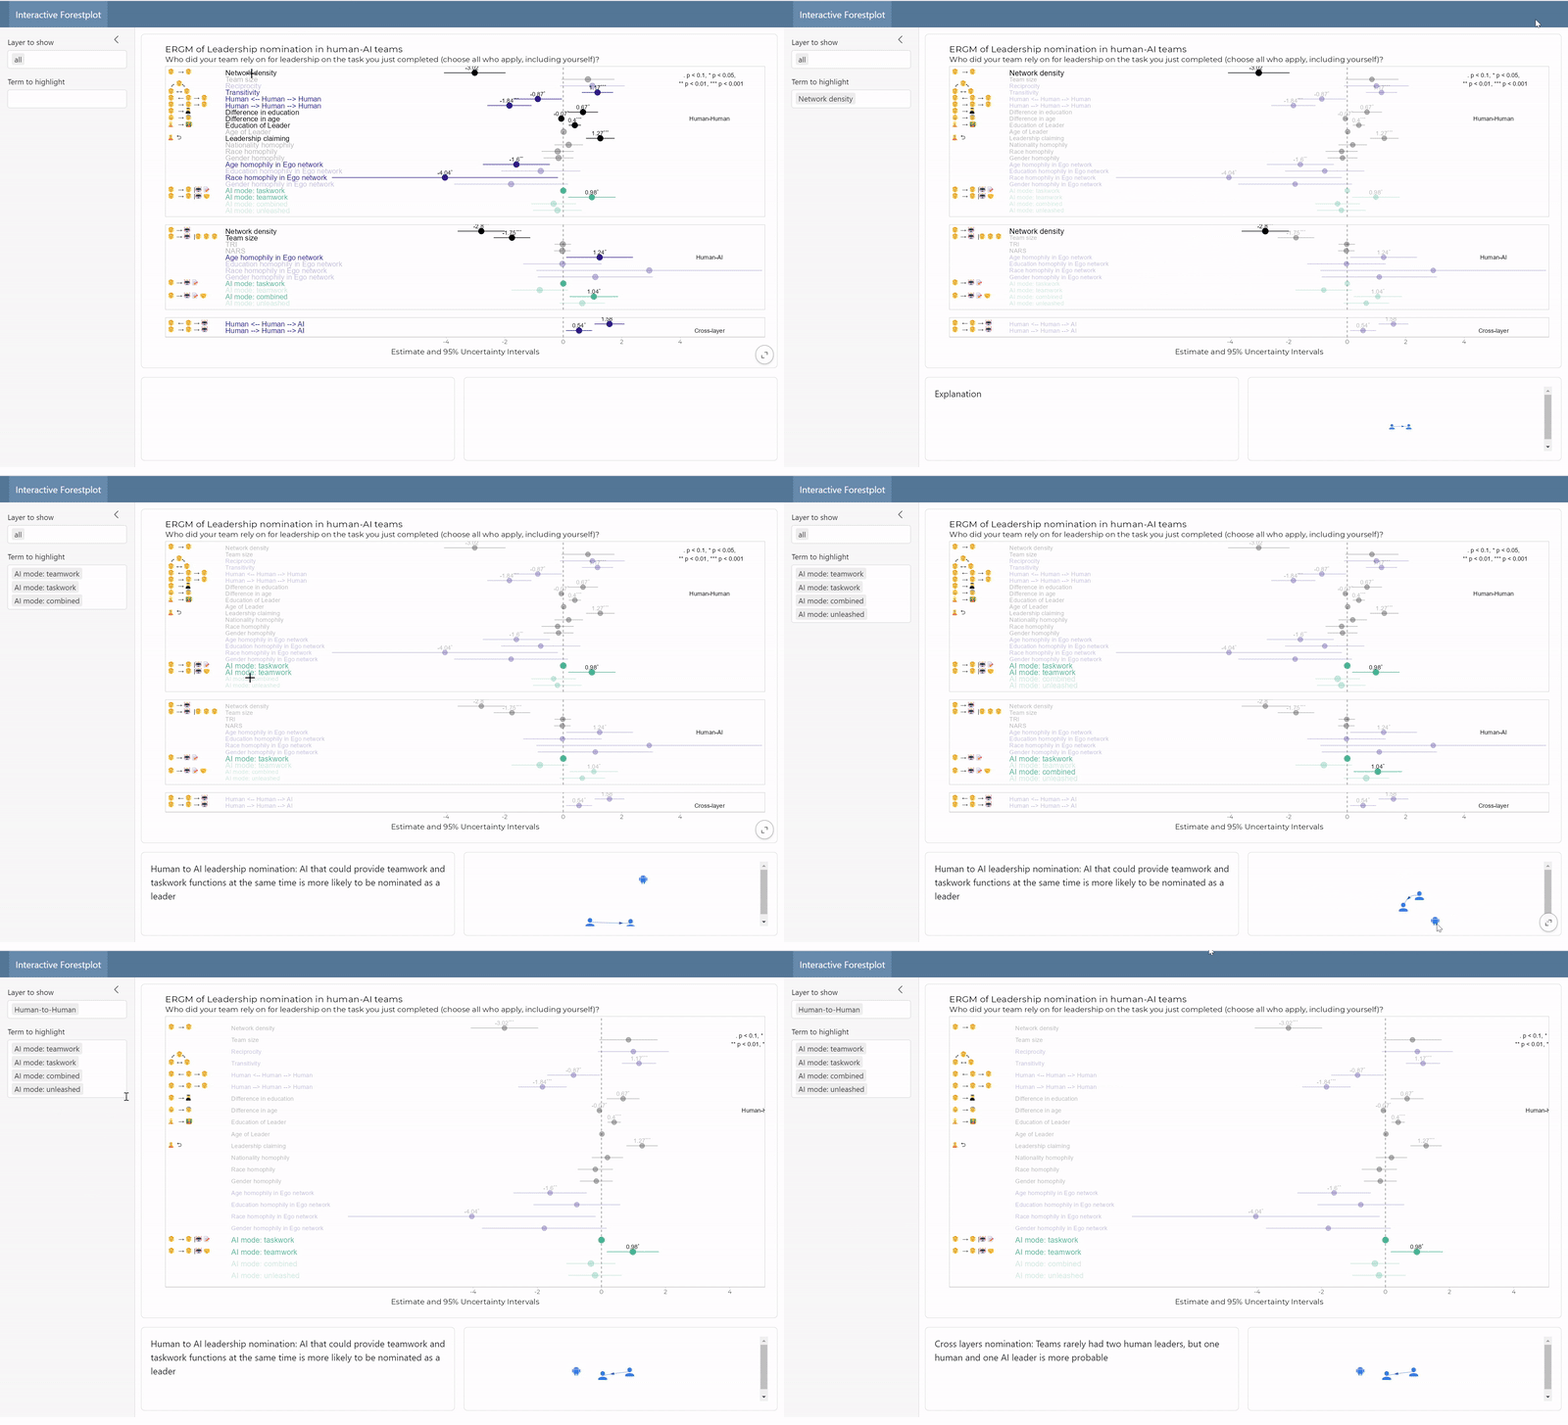
I tried to present the results of the multilayer-ERGM parameter estimate, uncertainty intervals (confidence intervals), and p-value cut-offs for the final model using forestplot, but it became humongous. The parameters for Human-Human and Human-AI leadership nomination are separated into rows, along with Cross-layer parameters that affect both types of layers simultaneously.
I used ggplo2 and ggtext with some emoji. Could be better, but it’s a start. Shiny input\(click\)y is used to highlight the clicked parameter, and it works like some sort of magic
